Skip to content
No results
  • Wealth
  • Work
  • Tech
Subscribe
The Global Frame
The Global Frame
  • Wealth
  • Work
  • Tech
Subscribe
The Global Frame
The Global Frame
A figure measuring against a ruler while the real horizon stretches behind them — representing how net worth benchmarks by age measure the wrong thing relative to actual financial security
  • Wealth
  • August 3, 2026

The Net Worth Benchmarks Are Made Up. Here’s What Actually Tells You You’re on Track.

'1x your salary by 30' describes how to reach a median retirement outcome — not a secure one. Here are the two metrics that actually predict financial independence and how to use benchmarks without being misled by them.

Two doors side by side — one appearing sturdier and safer with a heavier price tag, the other simpler — representing how PPO plans feel safer but cost more for generally healthy people
  • Wealth
  • July 28, 2026

The Health Insurance Choice Costing Healthy Americans Thousands Every Year

HDHP vs PPO in 2026: generally healthy people systematically overpay for PPO coverage by $1,200-$3,600 a year. Here's the math to run on your specific plans — and why the HSA changes the calculation more than most people realize.

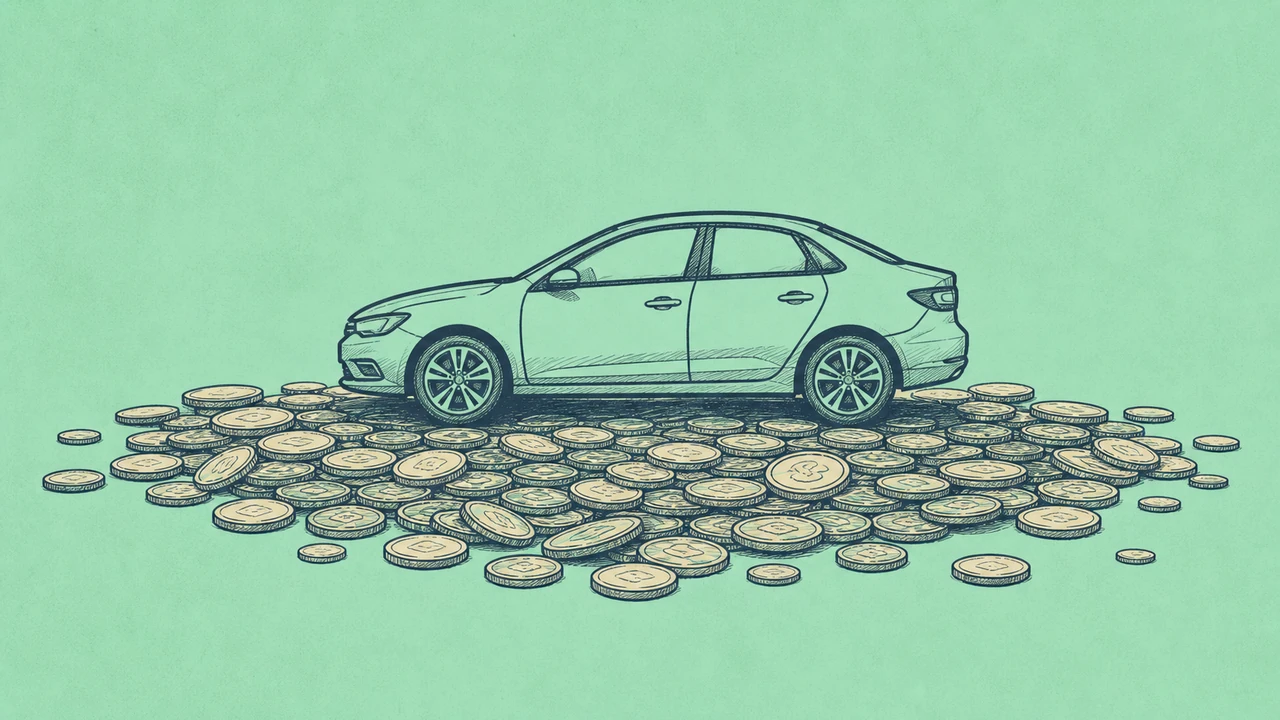
A car silhouette with a shadow made of coins beneath it — representing depreciation and the true hidden cost of car ownership that exceeds the monthly payment
  • Wealth
  • July 23, 2026

Your Car Payment Isn’t Your Biggest Car Cost. Depreciation Is.

AAA 2025: the average car costs $11,577/year to own — $965/month. Depreciation alone is $4,334/year and never shows up on a bill. Here's the math that changes how you think about which vehicle to buy.

A large single coin on the left shrinking into a scattered pile of smaller coins on the right — illustrating how compounding AUM fees reduce long-term portfolio value far beyond the stated percentage
  • Wealth
  • July 22, 2026

You’re Paying Your Financial Advisor Like a Landlord Charges Rent

A 1% AUM fee on a $1M portfolio costs $663,000 in lost compounding over 30 years — not $300,000. Here's why the fee model matters more than the advisor's skill, and what the alternatives actually cost.

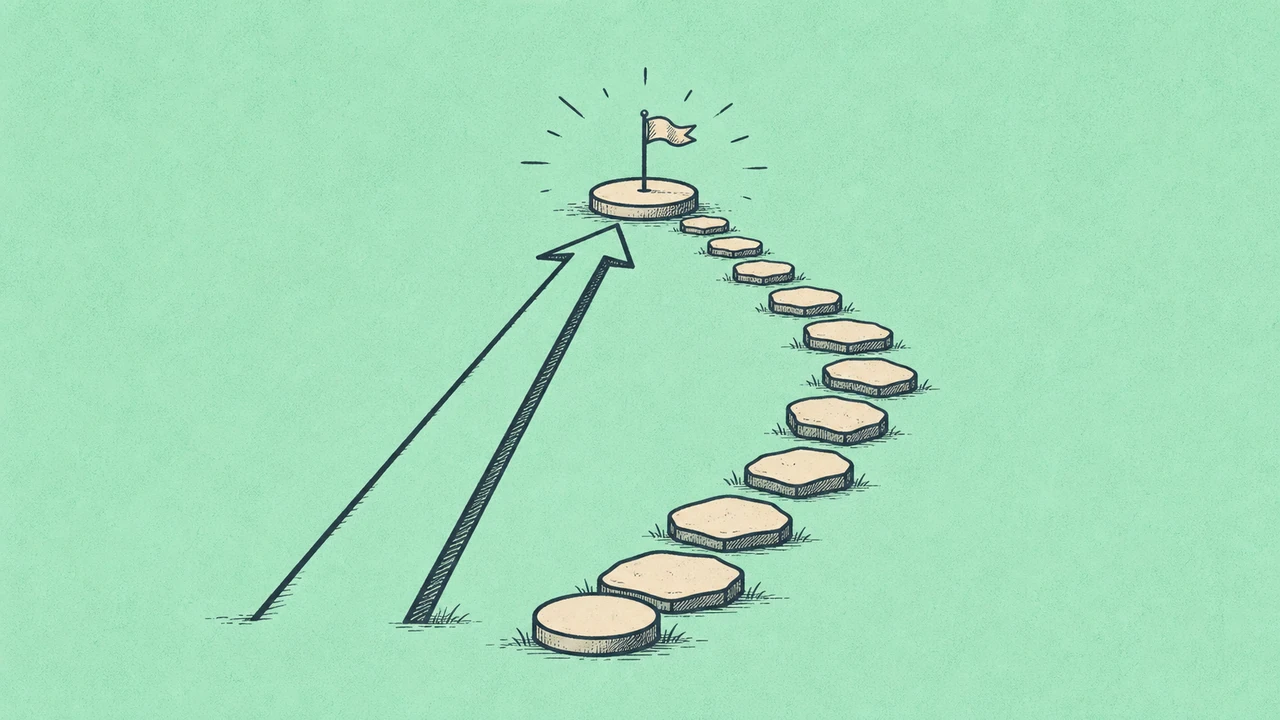
Two paths to the same destination — one direct arrow versus incremental steps — illustrating why lump sum investing tends to outperform dollar-cost averaging mathematically
  • Wealth
  • July 21, 2026

Dollar-Cost Averaging Is Good Advice. The Data Says It’s Not the Best Advice.

Vanguard's data across 1976-2022: lump sum investing beats dollar-cost averaging 68% of the time, with 2.3% average outperformance. Here's the honest case for both — and why the right answer depends on which failure mode you're protecting against.

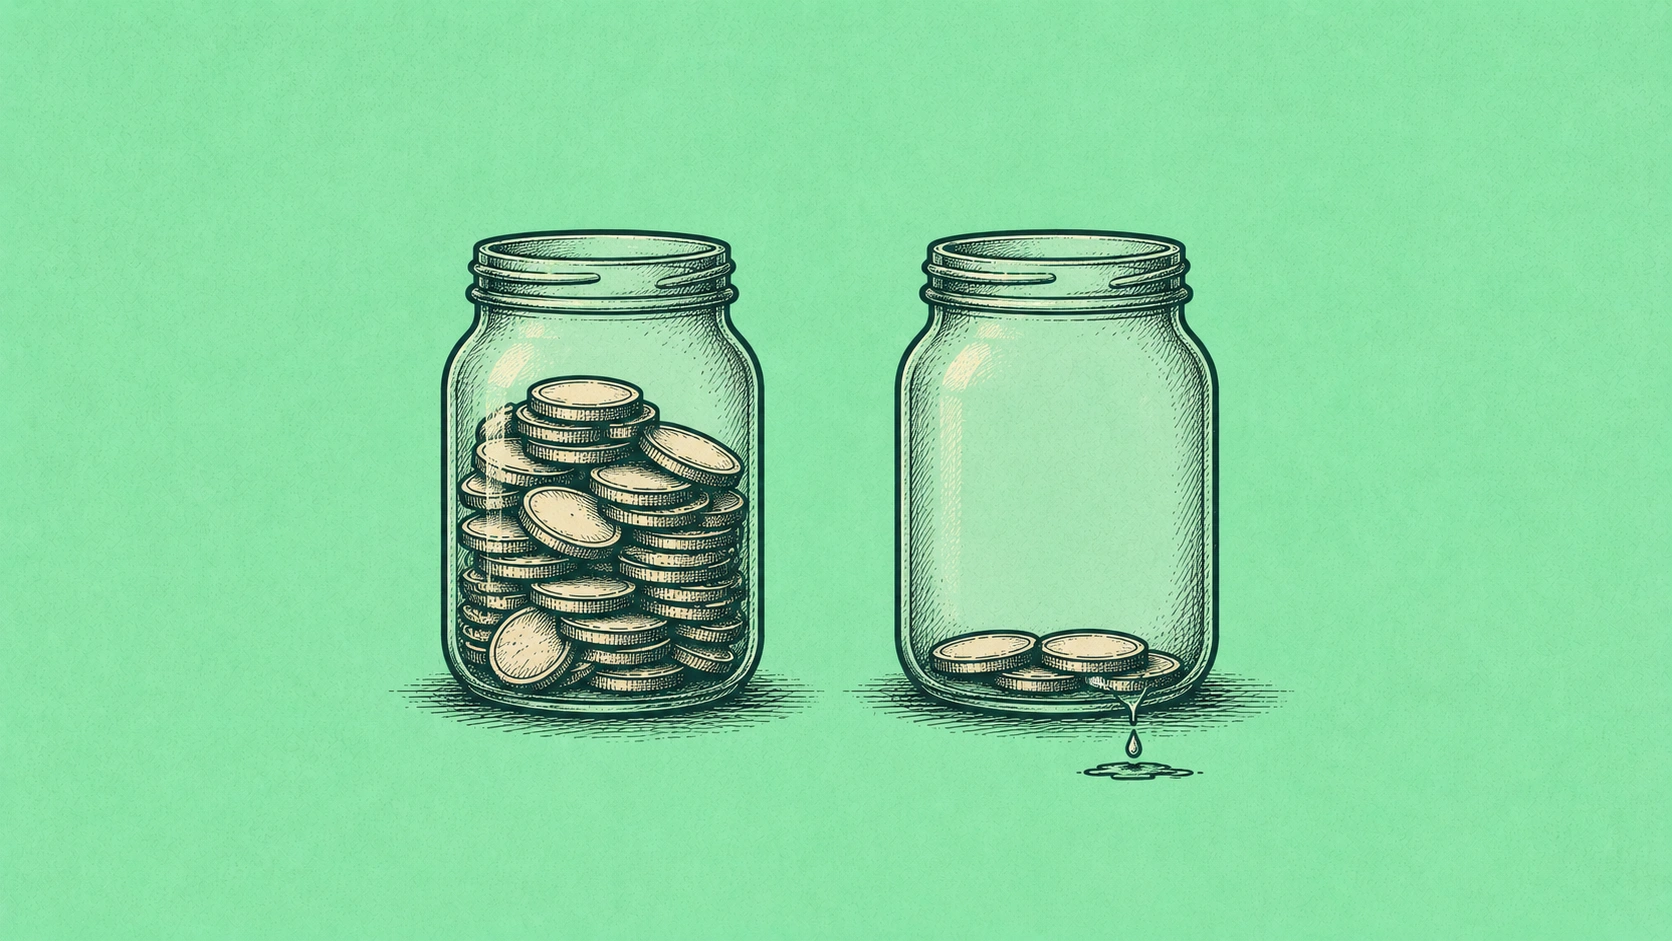
Two identical savings jars side by side — one full, one slowly draining — representing the hidden cost of staying in a lower-yield HYSA out of loyalty
  • Wealth
  • July 20, 2026

The HYSA Loyalty Tax Is Real and It’s Quietly Costing You Over $1,000 a Year

Ally is paying 3.00%. EverBank is paying 4.10%. On $100,000 that gap is $1,100 a year — and your bank isn't going to tell you. Here's why people don't switch and exactly how to do it.

Three buckets of different sizes in a row, each filled to a different level — representing the three-bucket cash allocation framework for emergency funds, near-term goals, and surplus
  • Wealth
  • July 17, 2026

Six Months Ago, the Cash Move Was Obvious. What Do You Do With It Now?

The people who locked cash into CDs in January got the better rates. Rates have since stabilized. Here's the right allocation framework for $10K, $50K, and $200K+ in mid-2026 — and the one question most people skip.

Simplified US map with a bold dividing line separating high-tax states from no-income-tax states — illustrating where T-bill state tax exemption matters most
  • Wealth
  • July 15, 2026

T-Bills Hit Different in High-Tax States. Here’s the Math by State.

A 3.93% T-bill isn't the same as a 3.93% HYSA in California or New York. The state tax exemption makes T-bills equivalent to a 4.40-4.50% HYSA in high-tax states. Here's the math for every major state.

A barely dripping faucet over a large empty bucket — representing how brokerage cash sweep defaults pay far less than better options available in the same account
  • Wealth
  • July 13, 2026

Your Brokerage Has Been Quietly Paying Your Cash a Terrible Rate

Schwab's default cash sweep pays ~0.48%. Fidelity's SPAXX pays 3.28%. SWVXX pays 4.40%. Your brokerage chose your cash rate for you — here's how to change it in 15 minutes.

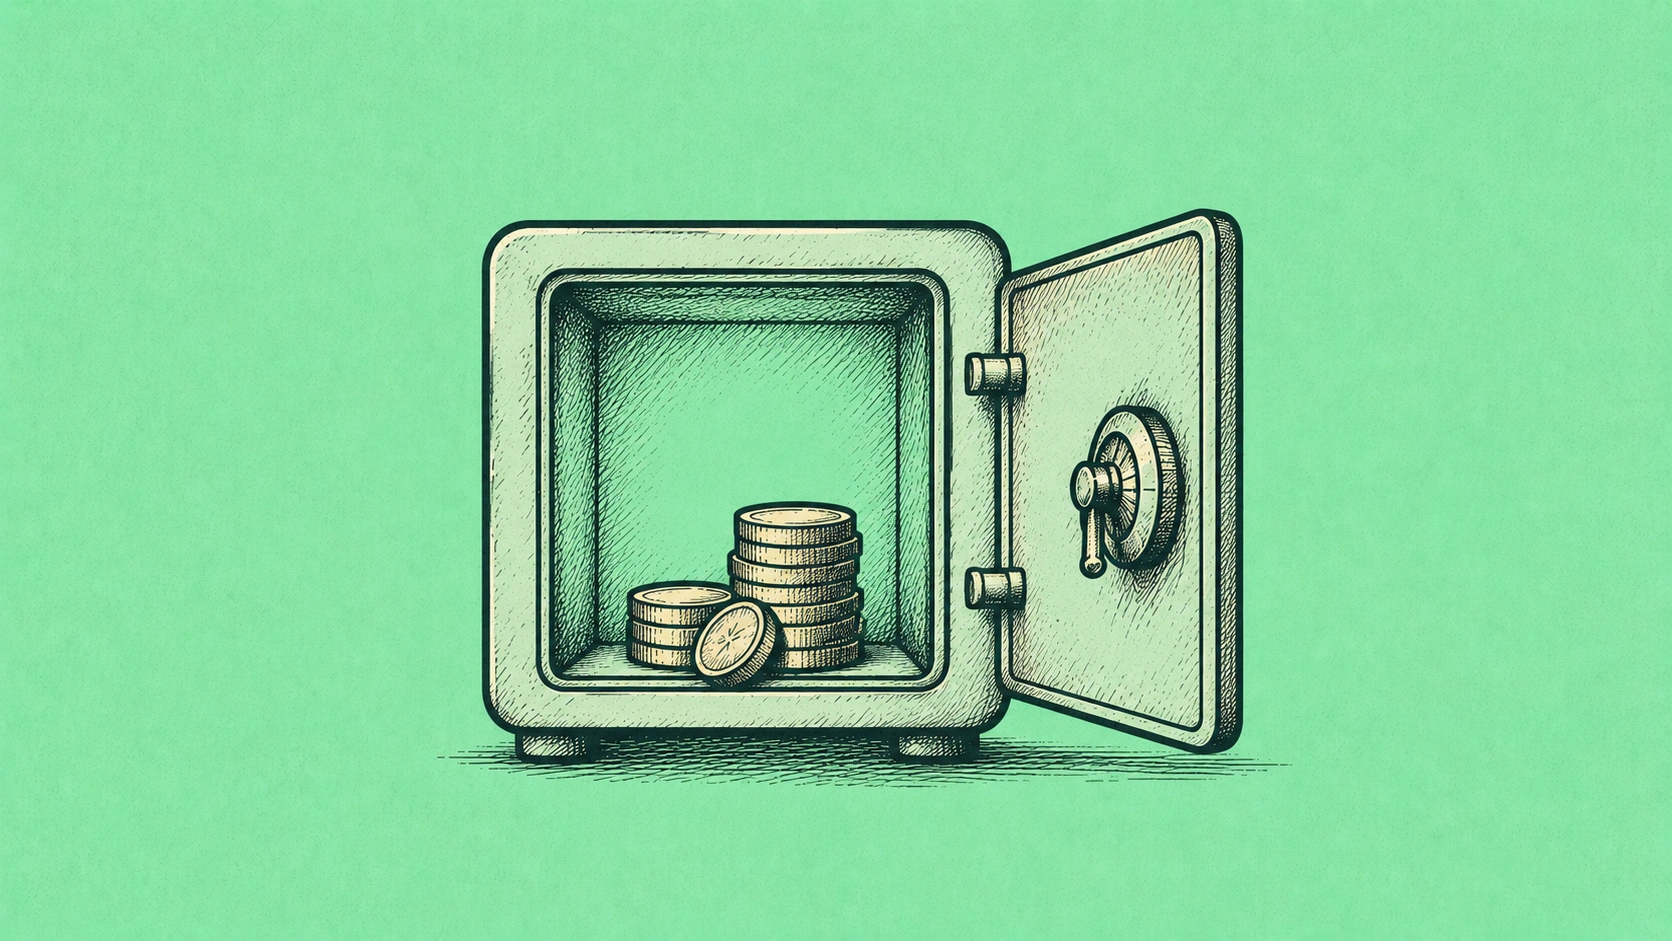
Open vault door with accessible coins inside — illustrating how no-penalty CDs offer CD-level yield without locking your money away
  • Wealth
  • July 10, 2026

Nobody Told You About the CD With No Penalty. Here’s What You’ve Been Missing.

No-penalty CDs pay more than most HYSAs and let you withdraw any time after the first week — no forfeited interest. Here's how they work and when they beat both standard CDs and savings accounts.

1 2 3 4 … 7
Next

Trending now

Dollar-Cost Averaging vs Lump Sum
  • Wealth
The Market Crashed. You Didn’t Sell. That’s the Whole Point.
green investing strategy
  • Wealth
The Green Investing Strategy Nobody Is Talking About (It’s Not What You Think)
Freelancing in 2026
  • Work
Freelancing in 2026: Why the Stability Argument Just Inverted
A hand typing at a keyboard with documents floating upward toward an unseen container — representing how AI tool conversations leave the device and are stored by providers
  • Tech
Your AI Tools Are Keeping More Than You Think. Here’s What They Actually Do With It.
  • editorial perspective
  • terms & conditions
  • privacy policy
  • contact us
  • archive

The Saturday Brief.

One read that actually changes how you think about money, work, and tech.

© 2026 - The Global Frame