Most personal finance arguments about dollar-cost averaging miss the point so completely it’s almost impressive. They debate whether DCA beats lump sum investing. They run backtests. They build tables. They conclude — correctly — that lump sum wins about 68% of the time, according to Vanguard’s research, and then present this as some kind of indictment.
It isn’t. It’s evidence that people are asking the wrong question.
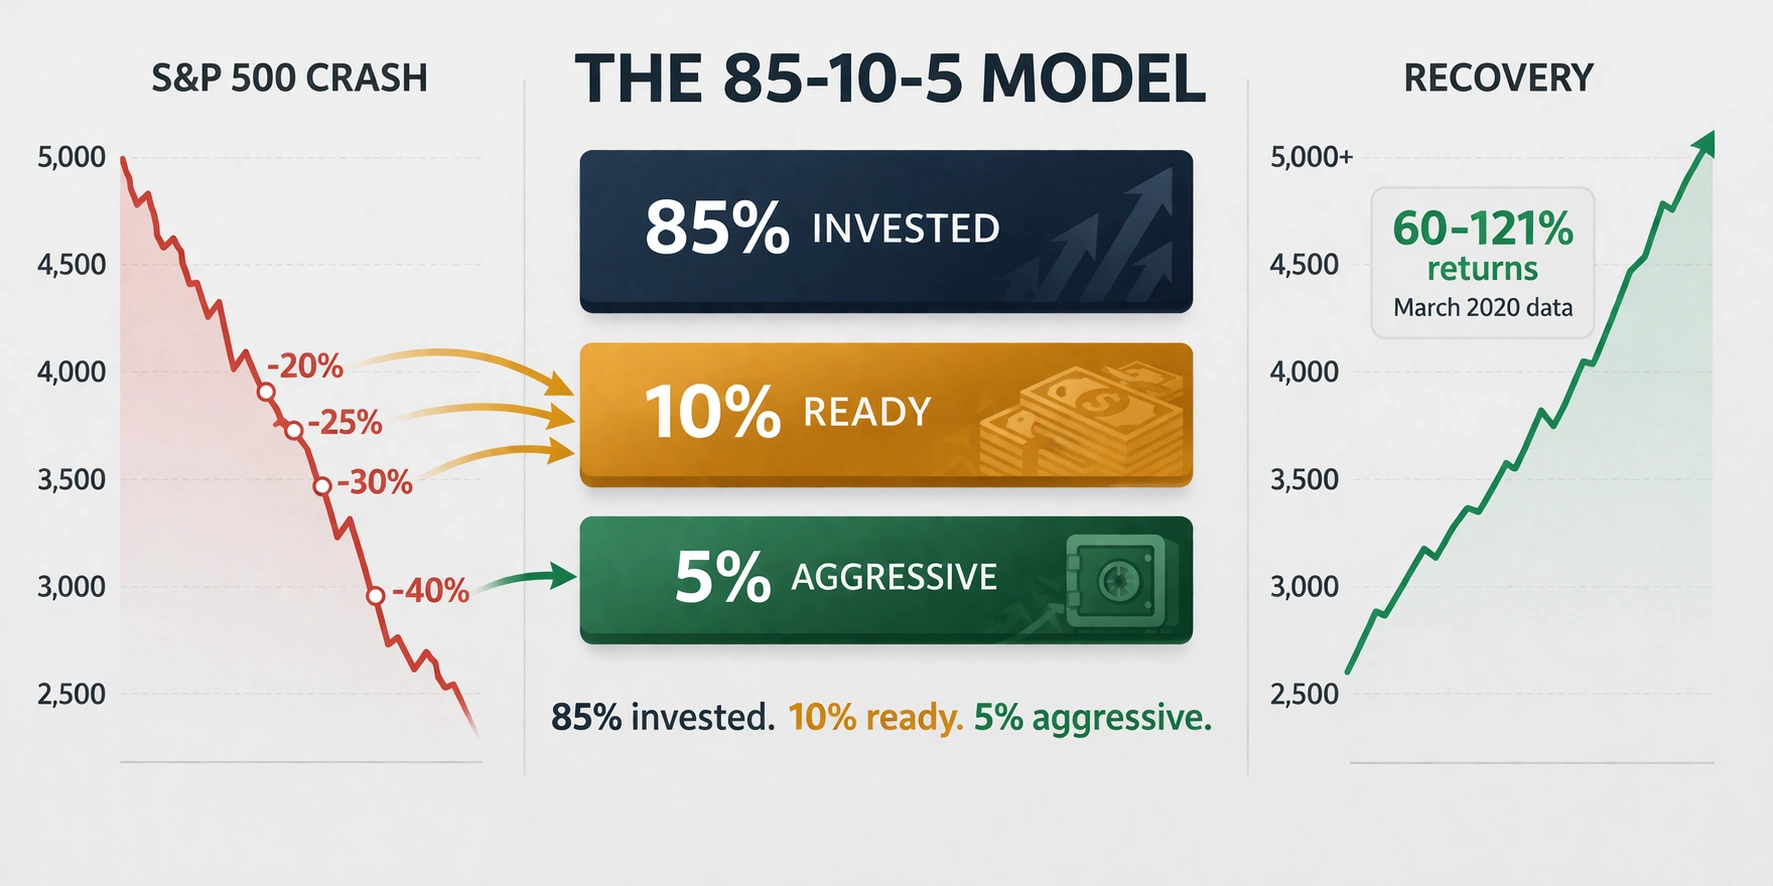
The right question isn’t whether dollar-cost averaging maximizes returns in a rising market. Of course it doesn’t — markets go up more often than they go down, so spreading purchases over time means buying some shares at higher prices than you needed to. That’s the design. What the lump-sum-wins argument consistently ignores is the only scenario where the math actually matters: a market crash. Not a theoretical one. The kind where your portfolio drops 40% in a quarter, your neighbor tells you he got out before it tanked, and every financial instinct you have is screaming at you to sell.
That’s what DCA is built for. And across every major crash since 2008, the data makes a case that has nothing to do with returns and everything to do with the difference between investors who stayed in the market and investors who didn’t.
Why 2008 Was the Real Stress Test
The 2008 financial crisis was genuinely different from every correction that followed it. Not because of the magnitude — though a peak-to-trough decline of 56.8% in the S&P 500 is staggering — but because of the duration and the total absence of any signal that the bottom was near.
An investor who put $10,000 into the S&P 500 as a lump sum on January 1, 2008 experienced a maximum drawdown of -51.13% by March 2009. Fourteen months of watching your investment lose more than half its value, with credible analysts arguing it could fall further. The same $10,000 deployed through monthly DCA across 2008 experienced a maximum drawdown of -43.91%.
That 7.22 percentage point difference sounds modest until you remember what it represents psychologically. The lump-sum investor watched $10,000 become roughly $4,887 at the trough. The DCA investor’s portfolio hit a low closer to $5,609. Same starting capital. Same index. The DCA investor bought shares at $900, then $800, then $700, then $600 — mechanically, without needing to make a single decision — while the lump-sum investor’s cost basis was fixed at January 2008 prices.
By 2022, the DCA investor held 1,046 shares versus the lump-sum investor’s 880, and their final portfolio value was $38,628 compared to $32,783. The DCA investor finished with $5,845 more — not because they timed anything, but because the structure of the strategy forced them to buy more when prices were lowest.
The critical asterisk: that return advantage only materializes for investors who didn’t panic sell in March 2009 when the S&P hit 676. Every dollar of that outperformance is conditional on staying in the game through the worst of it.
2020 Proved the Counterargument — And It’s Worth Taking Seriously
The COVID crash of 2020 is the honest case against DCA, and anyone who doesn’t acknowledge it is selling you something.
Join The Global Frame
Money, work, and tech — one read every Saturday that actually changes how you think.
The S&P 500 fell 34% in 33 days — the fastest bear market in recorded history — and then recovered in a near-perfect V. If you had $10,000 to invest in March 2020, the optimal move in hindsight was to lump sum on or near the bottom and hold. A DCA investor spreading that $10,000 across the remainder of the year bought progressively higher prices as the recovery gained momentum.
This is a real cost, not a theoretical one. In V-shaped recoveries, DCA’s advantage — buying more shares at lower prices on the way down — inverts. You’re still buying more on the way down, but the down doesn’t last long enough to matter, and you’re then forced to buy at higher prices on the way up.
The honest takeaway: DCA’s performance is asymmetric in ways that depend entirely on the shape of the recovery. Prolonged bear markets reward it. V-shaped recoveries punish it. Nobody knows which type they’re in while they’re in it.
This is actually why the behavioral argument is more honest than the returns argument. A DCA investor who stayed in through the 2020 crash and captured the recovery — even at progressively higher prices — beat the investor who fled to cash in February and waited for clarity that never came. Raymond James found that missing just the ten best days in the market over twenty years cuts annualized returns from 9.8% to 5.6%. Those ten best days almost always occur during or immediately after crashes. The investors who miss them are the ones who sold.
2022 Was the Year the Strategy Actually Made Sense
2022 deserves more attention than it gets in DCA discussions, partly because it lacked the single narrative clarity of 2008 or 2020. There was no Lehman Brothers moment. No pandemic. Just a grinding, choppy decline — the S&P 500 fell 18.1%, the Bloomberg Aggregate Bond Index fell 13%, and for the first time in decades, there was nowhere to hide in a conventional 60/40 portfolio.
That structure — sustained but non-catastrophic, with multiple false rallies — is exactly the market environment where DCA outperforms most consistently. Every time the market rallied 5-7% and investors held back waiting for confirmation, the S&P gave it back. Systematic buyers accumulated shares throughout that pattern without needing to decide whether the rally was real.
Investors running enhanced DCA strategies — doubling contributions during 5%+ market drops — captured even more of that advantage. From January 2022 through December 2024, enhanced DCA returned approximately 42.3% against traditional DCA’s 35.8% and a lump-sum position entered in January 2022 returning 29.7%.
The 2022 case is also clarifying about who DCA is actually for. It isn’t for the investor with perfect emotional discipline who can watch a 40% drawdown and feel nothing. That investor should probably lump sum — the math supports it. DCA is for everyone else. Which is to say, almost everyone.
The 2025 Correction and the Behavioral Proof
In March 2025, the S&P 500 entered correction territory, falling 10.1% from its all-time high in three weeks. The proximate causes were tariff uncertainty — average effective tariff rates jumped from roughly 2% to 12% — a Fed rate cut pause, and a visible deceleration in Magnificent Seven valuations. Nvidia alone shed $500 billion in market cap.
What made 2025 instructive wasn’t the size of the correction but the behavioral split it produced. Investors who moved to cash in February and March — reasoning that tariff risk was genuinely underpriced — waited for clarity. DCA investors kept buying at 10-15% discounts from the high. As of early 2026, the partial recovery has already made the DCA purchases look correct, though the full accounting won’t exist for another two or three years.
The pattern is identical to every previous correction: the investors most harmed weren’t the ones with suboptimal strategies. They were the ones who made a decision at the worst possible moment.
What This Actually Means for Your Portfolio
Since 1926, the S&P 500 has delivered positive returns over every single 20-year rolling period — not most, every one. Within those periods, corrections happen roughly 1.1 times per year. Bear markets — declines exceeding 20% — arrive about once every three years. If you’re investing over 30 to 40 years, you’ll live through ten to thirteen of them.
DCA doesn’t prevent losses in any of those events. It makes them more manageable, both mathematically (lower average cost basis, lower maximum drawdown) and behaviorally (the structure of regular purchases reduces the psychological pressure to make active decisions at the worst possible time). That second benefit is harder to quantify and consistently undervalued.
The barbell approach I use in practice reflects this honestly: automatic DCA through paycheck contributions to the 401(k) on a fixed two-week schedule, lump sum for any windfalls like bonuses or tax refunds because the math supports it, and tactical spread purchases when the Shiller P/E ratio exceeds 35 because that specific valuation threshold has historically preceded the correction environments where DCA’s advantage is largest.
In 2022, I kept the $500-per-paycheck contributions to VTI running through every monthly decline. It felt pointless. The market kept falling. Those purchases are up over 35% today. The feeling was irrelevant. The structure was the point.
If you’re the investor who can lump sum $100,000 into a broad market index today and genuinely not look at it for ten years, the Vanguard research supports doing exactly that. But if you’re a human being with normal psychological responses to watching your net worth drop 40% in a quarter, DCA isn’t about sacrificing returns. It’s about making sure you’re still in the market when the recovery happens.
The math only works if you don’t sell at the bottom. DCA’s entire value proposition is making that easier.
Frequently Asked Questions
Does DCA work in tax-advantaged accounts the same way?
Better, actually. In an HSA or Roth IRA, you’re not paying capital gains on the lower-cost shares you accumulate during a correction. The behavioral benefits are identical, but the tax efficiency compounds the advantage over time. The HSA is particularly powerful as a DCA vehicle — contributions are tax-deductible, growth is tax-free, and qualified withdrawals are tax-free.
What if I have a lump sum right now and markets feel expensive?
The Vanguard data still favors immediate investment about 68% of the time. If you can honestly assess that your concern is valuation rather than anxiety, and the Shiller P/E is above 30-35, spreading purchases over three to six months is defensible. If your concern is primarily emotional — you’re scared because markets have been volatile — that’s the exact scenario where DCA earns its keep behaviorally, not mathematically.
Should I double contributions during crashes?
The 2022 data supports it if you can do it consistently and without stress. Enhanced DCA outperformed by roughly 6.5 percentage points over that three-year period. The risk is that doubling contributions during a crash can feel psychologically destabilizing in ways that cause investors to stop altogether. A systematic, modest increase — say, 1.5x normal contributions during 10%+ declines — may produce better real-world outcomes than an aggressive doubling that you abandon in month three.
What’s the worst thing I can do during a market crash?
Move to cash and wait for clarity. The clarity never comes at a price that feels comfortable. The investors who missed the ten best days in the market over twenty years — those days that cluster around crash recoveries — saw their annualized returns cut nearly in half. Doing nothing, or mechanically continuing to buy, is almost always the correct move. Almost nobody does it naturally. That’s why the structure matters.